Showing posts with label experiment. Show all posts

Thursday, March 7, 2013

DNA Extraction from Wheat Germ

Instructions:

1. Place 1 gram of raw wheat germ in 50 ml test tub.

2. Add 20 ml of hot (50-60 C) tap water and mix constantly for 3 minutes.

3. Add 1 ml or a scant 1/4 teaspoon of detergent and mix gently every minut for 5 minutes. Try not to create foam.

4. Use an eyedropper, pipette, or piece of paper towel to remove any foam from the top of the solution.

5. Tilt the test tube at an angle. SLOWLY pour 14 ml of alcohol down the side so that it forms a layer on top of the water/wheat germ/detergent solution. Do not mix the two layers together. DNA precipitates at the water-alcohol interface (the boundary between the water and the alcohol). Therefore, it is crucial to pour the alcohol very slowly so that it forms a layer on top of the water solution. If the alcohol mixes with the water, it will become too dilute and the DNA will no precipitate.

6. Let the test tube sit for a few minutes. White, stringly, filmy DNA will begin to appear where the water and alcohol meet. You will usually see DNA precipitating from the solution at the water-alcohol interface as soon as you pour in the alcohol. If you let the preparation sit for 15 minutes or so, the DNA will float to the top of the acohol.
     You can usually get more DNA to precipitate from the solution by using one of the DNA-collecting tools (such as glass or paper clip hook) to gently lift the water solution up into the alcohol. This allows more DNA to come in contact with the alcohol and precipitate. You may find it helpful to pour the water/detergent solution into a clean test tube, leaving behind the wheat germ, before adding the alcohol.

7. Use a glass or paper clip hook or wooden stick to collect the DNA.

OBSERVATIONS

1. What does the "wheat germ soup" look like?
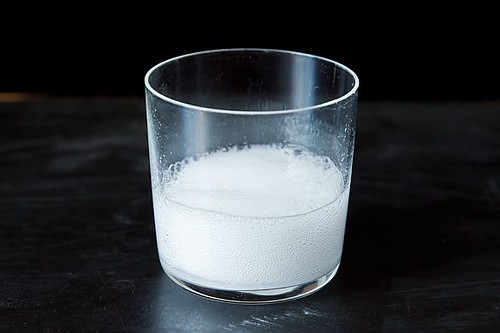
     The "wheat germ soup" looks much like watery snot...interesting....different.

2. How does its appearance change as you add the detergent and swirl it in?
     The "snot look" begins to form. The DNA, or "stringy parts" start to develop.

3. What do you think is happening at this step?
     The DNA is beginning to form.

4. Describe the appearance of the mixture just after you add the alcohol.
     The two solutions are separate, but in the same tube. It looks layered.

5. What do you think is happening at this step?
     The two solutions are separating so that DNA can form in between them. They're working as glues.

6. What do you observe at the water-alcohol interface?
     The wheat germ met the alcohol, so that's where the filmy DNA film started forming.

7. What does DNA look like?
     The DNA looks like snot. Creation of life is beautiful...but really not too pretty!


Wednesday, February 20, 2013

Let's Make A Baby!

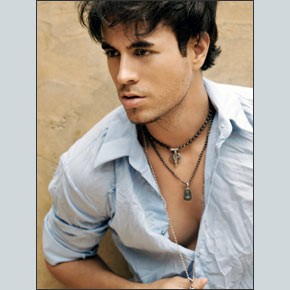
     For this experiment, my classmates and I were to partner up and make a baby! Not literally-but on paper with the cool, fun techniques of biology! As my class evened out to an ODD number of students that day, we decided that it would only be fair to make my partner the great and glorious Enrique Iglecias!

(Two pretty attractive people, we know!)
So for this project, my partner and I were to look at each others' faces and match up listed features on the page in order to decide upon which features our child will likely have. This helped us determine exactly how our child will look.


A long and tough process, but we were able to define each others' beautiful traits our child would probably be getting.


Following are the final results...

(Adorable!!)


Thursday, January 17, 2013

Onion Root Tips Mitosis WebQuest


ONION ROOT TIPS AND THE CELL CYCLE


In this activity, you will calculate the lengths of the various phases of the cell cycle in an onion root tip. First you will view some slides and graphics of onion root tips provided by the Molecular Expressions Photo Gallery. Then you will complete the online activity provided by the Biology Project at the University of Arizona.

Part 1.

Use your browser to go to Molecular Expressions Photo Gallery: Mitosis

http://www.microscopy.fsu.edu/micro/gallery/mitosis/mitosis.html

Notice in the micrograph at the top of the page that there are cells in a variety of stages. View the onion slides in this section, then click on "mitosis" in the sentence "Learn the steps in mitosis ... " This will take you to a Java tutorial.  Keep in mind what you have learned here as you proceed to the second part of the activity.

Part 2.

Use your browser to go to Online Onion Root Tips at

http://www.biology.arizona.edu/cell_bio/activities/cell_cycle/assignment.html
Begin by reading the description of the five major cell phases. You will need to keep this information in mind during the activity.

Make a copy of the data sheet that appears on the second page. You will need it to answer the questions.

Proceed through the activity, identifying the phase for each cell you are shown. Pay attention to the hints if you misidentify a cell at first.

When you have completed the activity, answer the following questions:

1. What percent of cells were in interphase?
20%2. What percent were in mitosis?
100% All of the cells are in different stages of mitosis.3. Which phase of mitosis takes the longest?
Interphase
4. During which stage is the nucleolus visible as a dark spot?
Prophase5. How can you recognize a cell in metaphase?
It doesn't seem as dark as prophase; It's much lighter and looks like it's beginning to separate.6. How might you figure out how long (in minutes and/or seconds) each phase of the cell cycle takes based on the data from these onion root cells? Explain your logic and show your calculations and results below.

7. Produce a pie chart in Create-a-Graph that shows the relative lengths of each stage of the cell cycle in these cells including interphase and each stage of mitosis. You can embed the graph here.


InterphaseProphaseMetaphaseAnaphaseTelophase
Number of Cells201032136
Percentage55.55%28%8.33%5.56%2.78%100%


Thursday, November 15, 2012

Microscopy

Your supplies:
2 Artifacts
1 Test Tube

Now let's do this!


The main objective in this project is to test the ability to use a microscope. Objectives will be tested.

Start off on lowest magnification possible, find the desired area, and magnify!

There is a part just below the microscope call the condenser. It has an iris under microscope. If no light is coming through, the iris must be twisted. So of course, this is a sign that there's a little bit of microscope anatomy we need to touch up on first!

There!
First, we tested hair! The outcome was very interesting. It looked like the following:

JUST KIDDING!

It REALLY looked like...


Next, we checked out some infected pork! That one was very interesting to see up close! It looked somewhat like the following...

Notice the three chunked spots. That, we concluded, is the infection. Pretty nasty, but neat, right??

Microscopes are awesome! Just with one little peek through, one's world can be completely magnified! Very nifty tool that everyone should have to experience in playing with!


Thursday, October 25, 2012

Diffusion and Osmosis Lab

     Diffusion and Osmosis are very similar and different. In this experiment, we will observe the strengths in their differences.
     As the lab analysis paper says, "molecules only move from regions of higher concentration to lower concentration during diffusion and osmosis. Cells often need to absorb molecules from regions in which concentration of the molecules may be lower than the concentration already inside the cell. The absorption of glucose from blood frequently occurs under these circumstances. Cells use the process of active transport to move substances through the cell membrane against a concentration gradient. Active transport involves proteins in the cell membrane and energy derived from ATP. Diffusion and osmosis do not require any added energy."
     A solution of glucose and starch will be placed inside a bag of dialysis tubing, and we will pour water into the beaker, outside the dialysis bag. We'll let it sit for about 30 minutes, and the solution inside the bialys is tubing and in the beaker were tested for glucose and starch. To test for glucose, we use indicator strips. To test for starch, we use Lugol's solution (iodine and potassium iodide) Starch appears to be a bluish-purple complex with iodine, and glucose does not.


Initial Contents
Initial
Final
Initial
Final
Bag
15% Glucose $ 1% Starch
Clear
Clear and Black
+
+
Beaker
H2O + IKI
Yellow and Brown
Clear
+
+


1. How would you explain the results you obtained? Which substances are entering the bag and which are leaving the bag?
    I believe that the water from the outside of the bag started to seep into the bag. I believe this because a color change, or chemical reaction, took place. I know that such a thing wouldn't happen unless the solution was mixed with another.

2. What evidence could have been collected to show quantitatively that water diffused into the dialysis bag?
    The amount of water outside the bag, and inside the bag. These measurements could have been taken before and after the experiment.

3. What results would you expect if the experiment started with a glucose and IKI solution inside the bag and only starch and water outside?
    The results would be different because the IKI would have mixed differently with the glucose solution than the simple water and iodine mixture did.


Thursday, September 27, 2012

Mono Di Poly Experiment

Monosaccharides build everything together and the most simple way to build them up is to join them together to create disaccharides. Then joining those together will give a polysaccharide.

1. We've got to figure out how tests work and what they tell.
     known solutions (mono, di, and poly)
   
MISSION:
Put mono, di, and poly through two tests (to see which ones have reactions)

TWO TESTS

TEST 1- Benedict's Solution (it's blue!)
     in separate test tubes (mono, di, and poly), add sugar solution and a squirt (not drops, but enough to get it visible in the pipettes) of blue benedicts. Heat for approx. 3-5 min. (will be removed from heater when a color change takes place)

(Pipettes in heater)

TEST 2- Iodine Tests (brown)
     in separate test tubes (mono, di, and poly), add sugar solution and a few drops of brown Iodine. Heat for approx. 3-5 min. (to be removed from heater once color change takes place)

BE ABLE TO TELL WHAT MONO, DI, AND POLY DO THROUGH EACH OF THESE TESTS
     When these solutions are put through these tests, a color change takes place! Some respond, and some don't.


-->
SUGAR
BENEDICTS
IODINE
Mono
+
-
Di
-
-
Poly
-
+


Christian knows that it is important to be safe and use an apron, as to protect himself and his clothes from harm's way!
-->
STARCH
BENEDICTS
IODINE
Mono
+
-
Di
-
+
Poly
-
-


Honey-Nut Scooter juice, anyone?


Carbohydrate Identification Lab Analysis Questions

Use your results from the carbohydrate identification lab and any notes or resources about carbohydrates to answer the following questions:

  1. Name the three categories of carbohydrates studied in this investigation.

In this lab, we used sugar, starch, and fiber.


  1. 2. What three chemical elements are present in all carbohydrates?

Carbon, Hydrogen, and Oxygen.
  1. Give two examples each of the names of sugar molecules from our discussion or the textbook/online that are:
    1. Monosaccharides-Glucose and fructose.
    2. Disaccharides-Lactose and maltose.
    3. Polysaccharides-Starch and glycogen.
  2. How many times larger is the number of hydrogen atoms than oxygen atoms in:
    1. water? The air is 11.1% water.
    2. carbohydrates? Same amount
  3. “Mono” means one, “di” means two, and “poly” means many. Why are these terms used in describing the three types of sugars? Those sugars are made up of one, two, or many different compounds that can be joined together.
  4. How can you tell by using Benedict’s and iodine solutions if a sugar is a
    1. Monosaccharide? Has a reaction.
    2. Disaccharide? Has no reaction.
    3. Polysaccharide? Color turns deep blue.
  5. A certain sugar has no change in color when tested with Benedict’s solution.
    1. Can you tell what type of saccharide it is? Yes!
  6. A certain sugar has a color change in Benedict’s solution.
    1. Can you tell what type of saccharide it is? Yes!
    2. Explain. The different types of reactions (and labels) help me to understand the differences between the saccharides.
  7. Give a examples of foods that contain
    1. Monosaccharides- Fruit, vegetables, and honey
    2. Disaccharides- Milk and yogurt
    3. Polysaccharides- Corn, rice, and bread


Tuesday, September 11, 2012

pH?

First, what is pH?
pH scale levels are measurements of acidic acid.

The following image is what a pH scale typically looks like (including examples for each level)...

So...what?
They usually range between 0 and 14, with 7 being the average pH.

H+=OH-    (OH is a hydroxide)
pH=7

H=OH=H2O

So just a few little facts about these "ph levels"...
  • We tend to have things that are a little bit higher in pH levels. The pH of blood and saliva and most of the body fluids are used to being in a specific sort of pH. They must be kept very much in control.
  • Pure water is a neutral pH level. So when products are mixed in with water, the mixture can become acidic or basic. 
  • Lots of foods tend to be acidic. Brussel sprouts, tangy foods, coffee, oranges, vinegar, and etc. (as seen in the above image)
  • Your body prefers a very specific level of pH.

So Let's Experiment!!!
What do we need?
  • vinegar
  • 25 mL grad. cylinder
  • universal pH paper
  • mortar and pestle crushing device
  • 4 beakers or cups, 50 mL volume
  • several coffee stirrers
  • 1/2 teaspoon + tablespoon measure spoons
  • baking soda + 3 other antacids with different active ingredients
  • clock with second hand
  • data records

Let's get started!
     First,  Then we measured the pH level of vinegar, which came out to be pH level 4. Then, 4 little cups were filled with 25 mL of vinegar and lined up to be tested.

     The average dosage of antacids of the two provided brands (Equate and Rolaids) was 2 tablets. 

     Next, my group squished up 2 equate brand antacid tablets into the little bowl. We added the mixture to one of the four cups of 25 mL vinegar. The reaction was very bubbly! The pH level for this came out to be 6.
     Then we mashed 2 Rolaid tablets and threw them into a second cup of the 25 mL vinegar. This, too, came out to be 6 on the pH scale.

     So NOW, we must put in some baking soda to the vinegar mixture! What happens? This reaction is pretty bubbly too, but settles down, unlike the previous two tests. The pH level tested here cam out to be 6, also.

     NOW for Equate's Liquid Antacid!! We poured 5 mL of this into the vinegar. No bubbly reaction came here, but the mixture took a cloudy look. The pH level of this mixture in particular was 3.

Preview of your graph

     So according to my results, the three antacids had the same reaction. They all brought the pH level up to 6. So really, you can pick from any of these antacids to use!

"Whooptydoo! But what does it all mean, Basil?"
     What does this all mean? Well, think about these acids in your stomach and how they work. You should have a pretty good idea why too much of a certain thing can give you a pretty bad stomach ache now!
     So, from this lesson, we can learn to watch out for the certain mixtures we take in to our bodies. We must be very careful-or else we can have a super bubbly reaction!


Enjoy! :)